Introducing new features and a brand new report!

Introducing the common affinity profile
The common affinity profile measures the audience of the campaign relative to the online population on five demographic variables; gender, age, income, education and household, where the average online population is set to 100.
Therefore a value above 100 indicates that there is a larger representation in the campaign than in the average online population, whereas a value below 100 indicates that there is a lower representation than in the average online representation.
Whether or not a number close to or far from 100 is good or bad entirely depends on the intended audience of the campaign. If the purpose of the campaign is to generate general awareness in the online population then numbers around or at 100 would be good. However, if the purpose of the campaign is to reach a more narrowly defined target group then success would be numbers that differ markedly from 100.

The illustration above of the common affinity profile is from a campaign that target well-educated women, therefore the large deviates from 100 on female and higher educated is sign that the campaign has reached the intended target group.
Introducing sample sizes
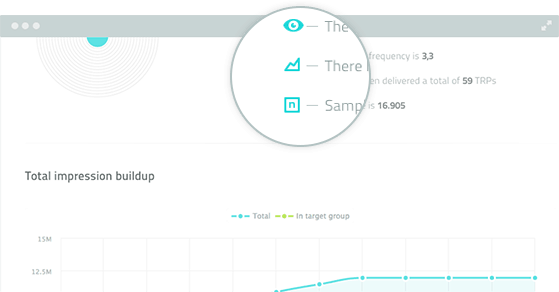
Sample size for the total campaign
On the overview report, you can see the total sample size for you campaign. Sample size is the amount of people exposed to the campaign. Unless, the campaign target group is very narrowly defined, the sample size will typically be in the thousands.
Sample size for part of the campaign
In addition, sample size can also be viewed for part of the campaign by looking at individual tracking pixels. In this case, sample size is the amount of people exposed to the tracking pixel. Unless, it is a very small campaign or very narrowly defined target group, the sample size will typically be in the hundreds.
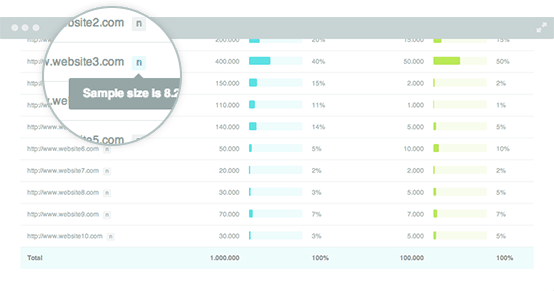
Easily spot the tracking pixels with low sample sizes
As a special safety feature, the new AudienceReport automatically alerts the users attention to a low sample size. The N tab at the individual tracking pixel will be yellow, if the sample size is close to a critical small size, and red, if the sample size is critically low or zero.
![]()
You might also like:

AudienceReport Q2 Update: The latest news on AudienceReport and what’s next

Introducing the new report builder: Create reports smarter and faster in AudienceReport

AudienceReport Q1 Update: What’s next in AudienceReport

AudienceReport Q3 Update: The latest news on AudienceReport and what’s next

Introducing Single Sign-On: Seamless and secure access to the AudienceProject platform is now available

AudienceReport Q2 Update: The latest news on AudienceReport and what’s next
Signup for the AudienceProject newsletter
Industry relevant articles, truth-revealing studies, exiting new product launches and random thoughts from brilliant people - directly in your inbox. Free of charge and no spam guaranteed!